The North China Plain (NCP) is among the largest grain producing regions in China, featuring high water demand, extremely dense population, a relatively dry climate (mean annual precipitation ∼500 mm/yr, 2000‒2018) and limited water resources (less than 500 m3/yr per capita). As a result, groundwater in the NCP has been overexploited (groundwater levels declining at a rate of ∼1 m/yr by the late 1990s) to meet societal and economic development needs, resulting in one of the most depleted aquifers globally. To partially mitigate water shortages in North China, the south-to-north water diversion (SNWD) with three routes (i.e., the eastern, middle, and western routes) was launched in 2002, and the middle route began to divert water to North China in December 2014. The middle route of the SNWD (SNWD-M hereafter) was initially designed to divert 9.5 km3 of water per year from the Danjiangkou Reservoir (in the middle reaches of the Hanjiang River, the largest tributary of the Yangtze River) to North China, including Beijing and Tianjin municipalities, and Hebei and Henan provinces. The diverted water with high water quality is mainly used for the domestic and industrial sectors as a substitution for groundwater pumping. The SNWD-M has improved the water supply structure in water-receiving regions, benefiting 79 million residents in North China. In addition, some of diverted water during flood seasons was used for water replenishment of rivers, lakes, and wetlands. As a result, groundwater levels (GWLs) along the channels rose and ecosystems are restored to some degree. Meanwhile, the SNWD-M project promotes implementation of related policies to improve water use efficiency and reduce groundwater pumping for agricultural use.
The objectives of this study were to (a) simulate GWS changes in the NCP using the high-resolution CWatM (∼1 km at the equator) that incorporates impacts of water use, water diversion, and climate variability during 2005‒2050, (b) formulate reasonable scenarios of future (2019–2050) water diversion, water use, and precipitation, and (c) project GWS changes using combinations of water use, water diversion, and precipitation scenarios, and evaluate the impacts of various factors on GWS changes in the water-receiving region of SNWD-M. Results of this study will be valuable in providing a reference for the operation and management of SNWD-M to achieve groundwater sustainability for the NCP. The approach and results should also be transferable to similar highly stressed aquifers across the globe. The research results were recently published in Water Resources Research under the title "Human Intervention will Stabilize Groundwater Storage across the North China Plain".
GWSA in the NCP during 2005–2018 was simulated by CWatM (i.e., GWSA-CWatM) and compared with GWSA-observed and GWSA-GLDAS. The GWS simulation for the NCP was improved compared with previous studies that used models such as CABLE (Community Atmosphere Biosphere Land Exchange), PCR-GLOBWB, WaterGAP v2.2 days, and WGHM with GRACE data assimilation. The r value during the 2005–2018 calibration period is generally acceptable (0.75), with the mismatch caused primarily by earlier peaks in simulated GWS than observed GWS that was also shown by previous studies. The simulated decreasing GWS trend from CWatM (−15.3 mm/yr) during 2005–2014 compares favorably with the trend from observed GWS (−15.5 mm/yr) but differs largely from the trend simulated by GLDAS (−8.9 mm/yr). For the period during 2005–2018 r is 0.80 and the changing rate of GWSA-CWatM is −14.5 mm/yr (−14.9 mm/yr of GWSA-observed).
The changing rate of GWSA-CWatM and GWSA-observed is close during calibration, which is an essential prerequisite to evaluating how GWS would change under various climate, water demand, and water diversion scenarios and to quantify their contributions to GWSC. The correlation coefficient between GWSA-CWatM and GWSA-GRACE during 2005–2018 is 0.79. In addition, the correlation coefficient between GWSA-CWatM and GWSA-GLDAS is 0.90 during 2005–2018. This indicates that GWSA-CWatM can replicate the timing of GWSC from the CLSM model in GLDAS through GRACE data assimilation by incorporating water demand and groundwater abstraction. To eliminate the impact of earlier peaks and seasonal variations in simulated GWS on GWSC, the study decomposed the simulated GWSA time series into trend, seasonal, and residual components using the STL method. The trend in GWSA time series was used to analyze GWSC under different scenarios.
Simulated GWSA shows a decreasing trend during 2005–2018 but the decreasing trend during 2015–2018 slows down. Increased precipitation and reduced water use have generally stabilized GWS in the NCP during 2008–2013. But low precipitation in 2014 (393 mm/yr relative to the driest period during 2000–2007 of 487 mm/yr and a long-term mean of 2005–2018 of 543 mm/yr) exacerbated GWS depletion. Water diversion during 2015–2018 was considered in the GWS modeling. Therefore, with contributions of stable precipitation (551 mm/yr), reduced water use, and water diversion, the depletion rate of simulated GWS reduced after 2015, similar to the results from a previous study that shows generally stable GWS during the same period.
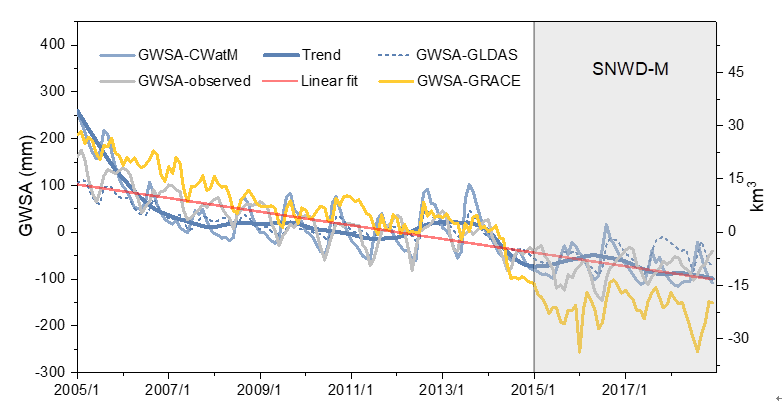
Groundwater storage anomaly (GWSA) simulated by CWatM (i.e., GWSA-CWatM, blue solid line), GWSA derived from in-situ measurements (GWSA-observed, gray solid line), GWSA-GLDAS (blue dash line), and GWSA derived mostly from GRACE observations (yellow solid line). The bold blue solid line is the extracted trend component of GWSA-CWatM and the red solid line is the linear fit of the trend to GWSA-CWatM. The gray box indicates the period of the operation of SNWD-M.
GWS projections during 2019–2050 were developed under different combinations of climate, water use, and water diversion scenarios to evaluate impacts of different factors on GWS. Two precipitation scenarios (PC and the CMIP6 precipitation from four GCM outputs), four water use scenarios (CTRL, SSP1, SSP2, and SSP3), and three water diversion scenarios (D1, D2, and D3) were assessed.
In general, decreasing water use (CTRL) combined with water diversion can result in stabilized GWS in the future. However, if water use keeps increasing without water diversion (e.g., for SSP3-NoD, the default precipitation symbol refers to CMIP6 precipitation from three GCMs (CNRM, GFDL, and MRI) hereafter), GWS can substantially be depleted. In the CTRL group, impacts of different diverted water amounts and operation modes of SNWD-M on GWS were evaluated. Water diversion may increase GWS by up to 144 mm (19 km3) by 2050 (CTRL-D2 compared with CTRL-NoD). D1 and D2 with mean annual water diversion amounts of 5.6 and 7.1 km3 for 2019−2050 may lead to a difference in groundwater recovery of 20 mm (3 km3). GWS under the D1 and D3 scenarios shows similar trends (CTRL-D1 compared with CTRL-D3). GWS in 2050 under D3 is slightly higher than GWS under D1, indicating that varying operation of SNWD-M from year to year may have a limited impact on GWS in the water-receiving region. Thus, with similar effects on GWS recovery in the water-receiving region, optimized operation of water diversion (D1, i.e., the diverted water amount depends on available water resources in the water-source region and water-receiving region) has potential to cut expenses of SNWD-M operation and to improve its ecological benefits in the water-source region. In addition, GWS may recover up to 150 mm (20 km3) with mean annual precipitation of 605 mm/yr during 2019–2050 under the HiRAM-CTRL-D2 scenario.
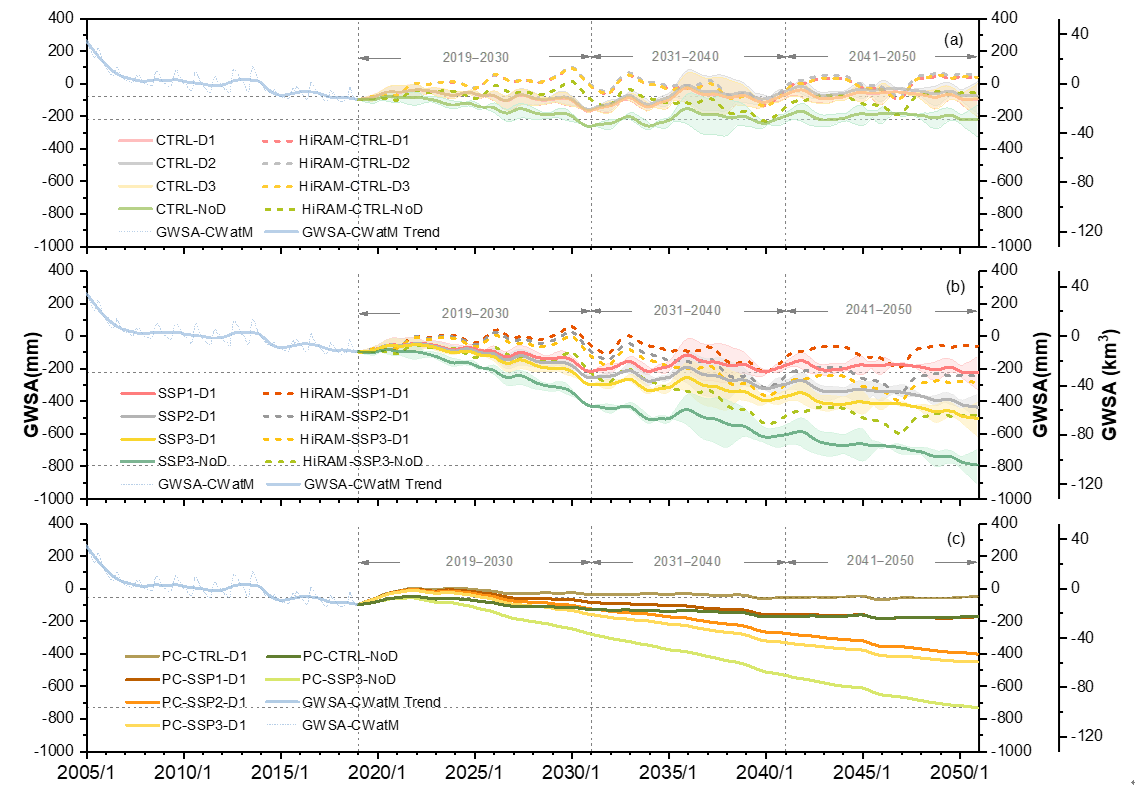
Groundwater storage anomaly (GWSA) simulation (2005–2018) and projections (2019–2050) in (a) CTRL group, (b) Shared Socioeconomic Pathways (SSP) group, and (c) precipitation climatology (PC) group.
To quantify impacts of water diversion, water use, and climate variability on GWS, PC-SSP3-NoD (with the minimum GWS in 2050) and HiRAM-CTRL-D1 (with the maximum GWS in 2050), as well as a series of intermediate scenarios were selected for comparison. The difference in GWS at the end of 2050 between two extreme scenarios (i.e., PC-SSP3-NoD and CTRL-D1) was taken as the total amount, and then contributions (%) of each factor to GWS recovery were calculated using the difference in GWS between corresponding scenarios. In general, water use reductions, water diversions, and precipitation can contribute to groundwater recovery by up to 73% (PC-CTRL-NoD vs. PC-SSP3-NoD), 37% (PC-SSP3-D1 vs. PC-SSP3-NoD), and 32% (HiRAM-SSP3-NoD vs. PC-SSP3-NoD). Given less available water resources (no water diversions), the increased water use results in more GWS depletion. For example, water use increasing from the CTRL to SSP3 scenarios contributes to 73% of GWS depletion under the PC-CTRL-NoD versus PC-SSP3-NoD, and 52% of GWS depletion under the PC-CTRL-D1 versus PC-SSP3-D1 scenarios. The contribution of water diversion to groundwater recovery is more significant with the highest water demand (SSP3) and less available water resources (PC), for example, 37% under PC-SSP3-NoD versus PC-SSP3-D1 and 12% under HiRAM-CTRL-NoD versus HiRAM-CTRL-D1. Overall, changes in water use and water diversion dominate GWSC in the NCP, and impacts of diverted water on GWS may be amplified with increasing domestic and industrial water demand in the future.
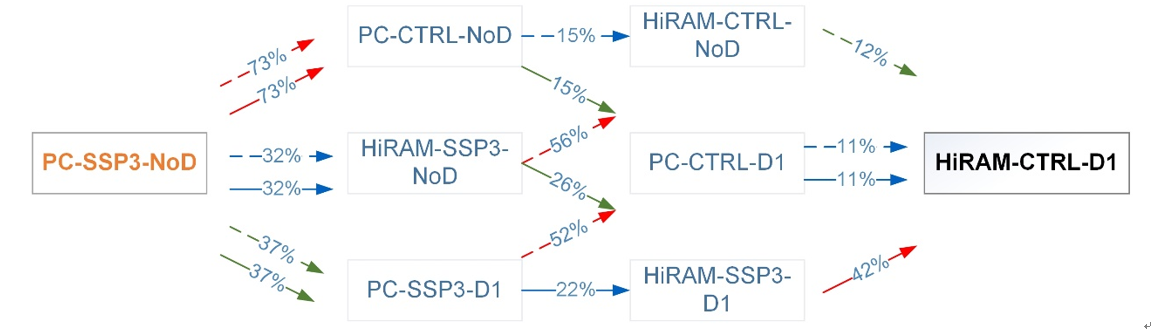
Contributions of water use (red lines), water diversion (green lines), and precipitation (blue lines) to groundwater recovery. Lines in three colors (red, green, and blue) from left to right of the same type (i.e., solid or dash) are within one group (e.g., PC-CTRL-NoD vs. PC-SSP3-NoD; 73% [red dash line], CTRL-NoD vs. PC-CTRL-NoD; 15% [blue dash line], and CTRL-D1 vs. CTRL-NoD; 12% [blue dash line]).
Results indicate that promotion of water-saving technology, improvements in water management, and implementation of related policies are vital to stabilizing GWS in the NCP. In addition, operation of SNWD-M should alleviate water crisis and groundwater depletion across the NCP. This study can be valuable for operation of SNWD-M and water resource management in water-receiving regions with impacts of climate change and human interventions. Also, it could serve as a basis for evaluation of other water diversion projects globally.
This study was jointly supported by the National Key Research and Development Program of China, the National Natural Science Foundation of China, the Major Science and Technology Projects of Inner Mongolia Autonomous Region, and Beijing Outstanding Young Scientist Program.
 Department of